Gaia catches the beat
Something is playing the Milky Way is like a drum, making unheard cosmic music.
At least, “unheard” until now.
Thinking of the Milky Way as a drum is a rather approximate analogy, as its disk of hundreds of billions stars - held together only by their collective gravity - is hardly like the taut membrane of a drum. Nevertheless, the latest data release of ESA’s Gaia mission has revealed clear evidence, from the motion of millions of stars near the Sun, that something disturbed the disk of the Milky Way hundreds of millions of years ago, and that its stellar disk is still “ringing” today with cosmic vibes.
Traditionally the motion of individual stars is approximated as a combination of a general rotation about the center of the Galaxy, and an oscillation about this approximately circular orbit. (By “oscillation” I mean a back-and-forth motion, like that of a pendulum.) This oscillation happens in all directions, vertically and in the plane of the disk of the Milky Way. But let’s simplify to one dimension and consider just the vertical motion of the stars: As they move up and down they are moving fastest when they go through the mid-plane of the Galaxy, gradually slow, reach a maximum height, then return in the other direction. What makes each star return to make another passage through the mid-plane of the Galaxy is gravity – just like a pendulum.

Fig caption: Schematic of stellar motion showing rotation and vertical oscillations.
We can plot this one-dimensional back-and-forth pendulum motion as a function of time, or we can plot it in velocity-position space, also called phase space. In this velocity-position space the pendulum just traces a circle as it oscillates back and forth, reaching a maximum positive or negative velocity (the vertical axis) at a zero spatial displacement. The larger the amplitude of the motion, the bigger the circle that is traced out. The faster the pendulum runs about its circle, the higher the frequency of its oscillations.

Fig caption: Time series and phase portrait of pendulum motion.
The expectation was that while each star is moving up-and-down like a pendulum, all the stars are doing so in an uncoordinated matter, each with a different amplitude and at some random point on its phase-space circle. So if we were to plot the current position of many stars in this phase space we would get a circular blob centered on zero. Furthermore, we expected that a star’s vertical motion would be mostly unrelated with its oscillation in the other directions. So, for instance, if we color each star according to its velocity toward or away from the Galactic center, or it’s rotation velocity, we would not see any obvious pattern. That is, we would expect to see something like this:

Fig caption: Plots from a simulation of a stellar disk in equilibrium. Left most: stellar density; middle: colored with respect to the average radial velocity, the velocity toward/away from the Galactic center; right: colored with respect to azimuthal velocity, the velocity of rotation about the Galactic center.
Gaia has in fact measured the positions and velocities of millions of stars near the Sun, so that with Gaia data we can make such plots as these. And it was quite a surprise:

Fig caption: Same as previous plot, but now compared to Gaia data.
Groovy spirals!
What we see is that the stars aren’t moving completely randomly with respect to one another, but in a coordinated manner, and that their vertical motions are correlated with their motions in the plane of the Galaxy.
What might cause such spirals in this phase space?
Thanks to air friction, real pendulums do in fact trace such spirals: they gradually slow down, each swing a little smaller than the previous, until it comes to a stop. But this explanation doesn’t work for stars. Space for them is practically a perfect vacuum, and they should continue on their circular tracks, unless some chance encounter bumps them to a different track.

Fig caption: Phase space of a pendulum moving in air.
To explain how these spirals form, we must suppose that something happened to all the stars. It may be a bit oversimplified as a physical model, but let’s suppose we push all the stars together below the disk, and that the collective gravity of the Milky Way continues to pull them back to center. What would happen is something like this:

Fig caption: Toy model simulation of a population of stars initially displaced from equilibrium.
In other words, if something gave all the stars a push at the same time, the after effect would be just such spirals that we see in the Gaia data. This spiral forms because the stars move up-and-down at different frequencies, but the stars with a smaller amplitude of oscillation (on a smaller circle) oscillate at a higher frequency, completing their up-and-down cycle faster than the stars that move further from the mid-plane, running on larger circles. The blob gets stretched into a spiral. The number of turns there are to this phase spiral depends on how much time has passed since the initial perturbation from equilibrium took place, and how much faster the stars with smaller amplitudes can complete a lap compared to the stars with larger amplitudes.
This difference in the vertical frequency of stars with different vertical amplitudes is what causes phase spirals seen in the animation above and those seen in the density of stars in the velocity-position phase space (left most plots), but it isn’t enough to explain why the spirals are even more obvious when we plot, in the same phase space, the magnitude of one of the velocity components in the plane (middle and right plots above). These spirals indicate that the stars are also moving in an unexpected manner such that their vertical oscillations are coordinated with their oscillations parallel with the plane of the Galaxy.
To explain these coordinated oscillations one must remember that the stars in these plots, though found near the Sun, come from other regions of the Milky Way’s disk due to their in-and-out oscillations. To conserve their angular momentum those that came from further out must rotate about the Galaxy a bit faster, while those that came from further in must slow down. We also expect that, because the surface density of the galactic disk increases as one move inwards, so the force pulling stars back to the mid-plane will be larger, making the vertical frequency higher for those stars that came from further in, so that they race around a bit faster on their track in phase space. Meanwhile, those stars coming from further out are going around a bit slower. So, how much faster or slower a star is “running” is correlated with their motion in the plane of the Galaxy, thanks to conservation of angular momentum.
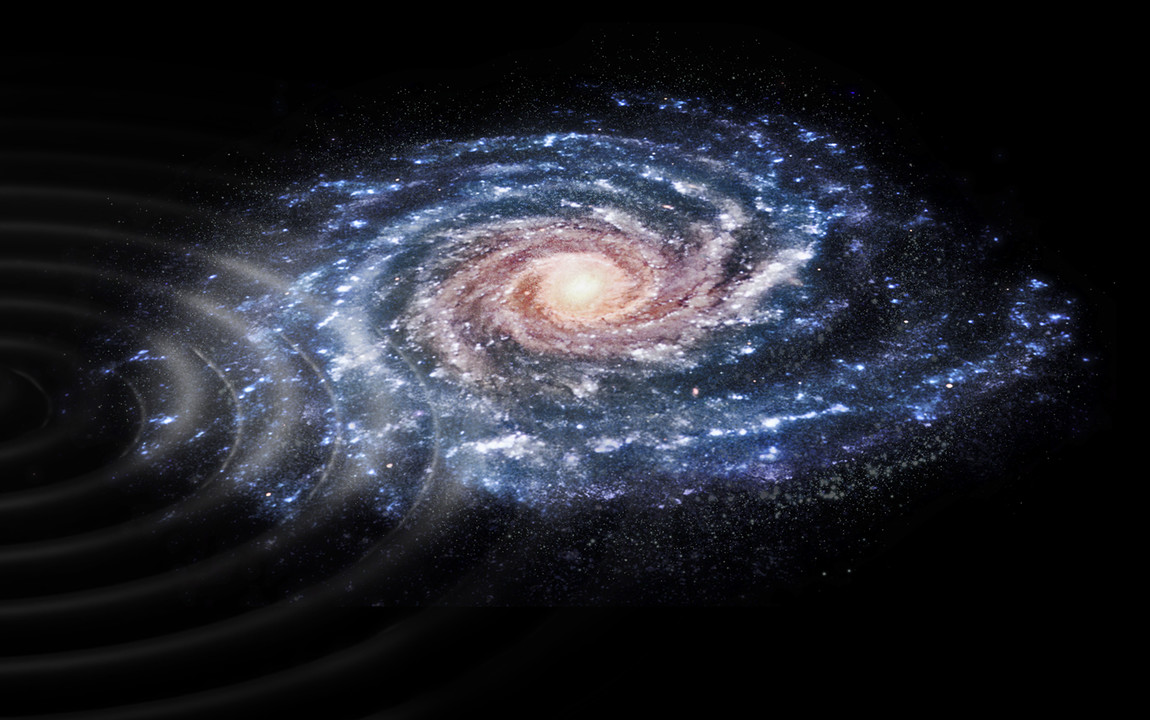
But what caused this perturbation to the Milky Way’s disk in the first place? Who might be our mystery cosmic drummer? Currently the primary suspect is a small satellite galaxy hiding on the opposite side of the Milky Way. This galaxy, called the Sagittarius dwarf galaxy, is the closest neighboring galaxy to our Milky Way. So close, in fact, that it is already plowing through the outer regions of our Galaxy, setting up an invisible wake in the halo of the Milky Way. The gravity from this wake is causing the Sagittarius dwarf to slow down, so its cosmic dance with our Galaxy will not go on forever: each orbit brings it closer, so that this small companion traces out its own spiral as it spins about our home galaxy. Their mutual attraction will eventually cause them to merge to become something even greater.
Thanks to Gaia we are hearing the music of their cosmic dance.
Ronald Drimmel is a research astronomer studying the Milky Way at INAF-OATo and can be found on Twitter @rdrimmel.
Further reading for the astronomically inclined:
Discovery paper: A dynamically young and perturbed Milky Way disk, T.Antoja et al.
Other relevant papers:
- The origin of the Gaia phase-plane spiral, J.Binney & R. Schönrich
- Emergence of the Gaia Phase Space Spirals from Bending Waves, K.Darling & L.M.Widrow
- Footprints of the Sagittarius dwarf galaxy in the Gaia data set, Laporte et al.
- The GALAH survey and Gaia DR2: dissecting the stellar disc's phase space by age, action, chemistry and location, J. Bland-Hawthorn et al.
Data Scientist
5yVery nicely written! Exciting times for Gaia and you guys!
Lead Consultant at Virtusa
5yThis is useful. As much as I found the (static) plot in the press release fascinating I couldn't make much of it. The additional explanations and plots here are quite helpful, although I never thought I'd come across an astronomy explainer on LinkedIn. :)